
Return on Investment This Nugget has been written by JimC on 5 Jun at 4:37PM Category: Moebius Moguls This chart shows the clubs which provide (in theory) the best value for money. There are two main factors behind the calculations: The cost of membership versus the income received, and the frequency that a club is landed on. 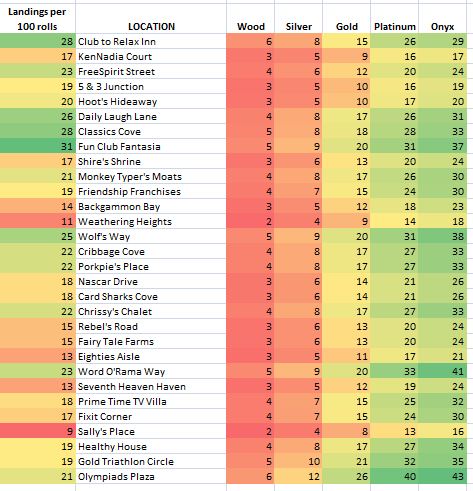 Landing Frequency The left column shows the average number of times a club is landed on every 1000 rolls. This is based on actual game statistics. The distribution is not level because the game will sometimes send players to a new location after a dice roll (because of Risky and Sticky cards etc.) So for example Sally's Place is landed on a lot less often than Fun Club Fantasia. Return on Investment The columns on the right combine the frequency landings with the return on investment (ROI) which is calculated from the cost of buying and upgrading a club compared to the income received when your opponent lands on it. For example, if you own Club to Relax Inn and Olympiads Plaza, they both provide the same return at Wood level. But Olympiads Plaza provides a much higher return than Club to Relax Inn when the clubs are upgraded to Onyx. In another example, we see that there is not much to be gained by upgrading KenNadia Court to Onyx from Platinum. The numbers don't mean anything - It is the relative values that count. The colours are the best guide. Red is a low return - green is high! How to use the chart With a pinch of salt! The values are averages calculated over thousands of dice rolls. But an individual game might have only 100 dice rolls. So any individual game can give very different outcomes to the long term average. And of course, a club with a high ROI is no good to you if you don't land on it early and buy it. Perhaps one use is to give a priority on which clubs to upgrade if you own several. For example, the chart suggests that if you own Weathering Heights and Wolf's Way you should upgrade Wolf's Way first. Frequency of landing for all squares on the board This chart shown how often you are likely to land on every area of the board for every 1000 rolls: 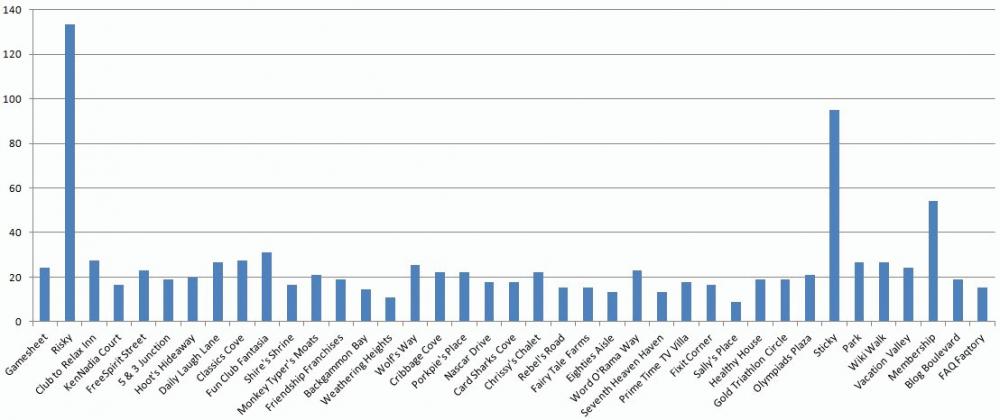 Risky and Sticky outnumber any individual club, because they exist in multiple locations. I like the wave pattern that emerges - I wonder if the game designers did that deliberately? How was all this calculated? There's no room here to show all the calculations - I will post them to my blog soon! Nugget Votes This Nugget has received 10 upvotes and no downvotes. You need to log in first to vote on Nuggets. Nugget Comments No comments have been posted yet. |
©2000-2024 GoldToken.com LLC. All rights reserved. |